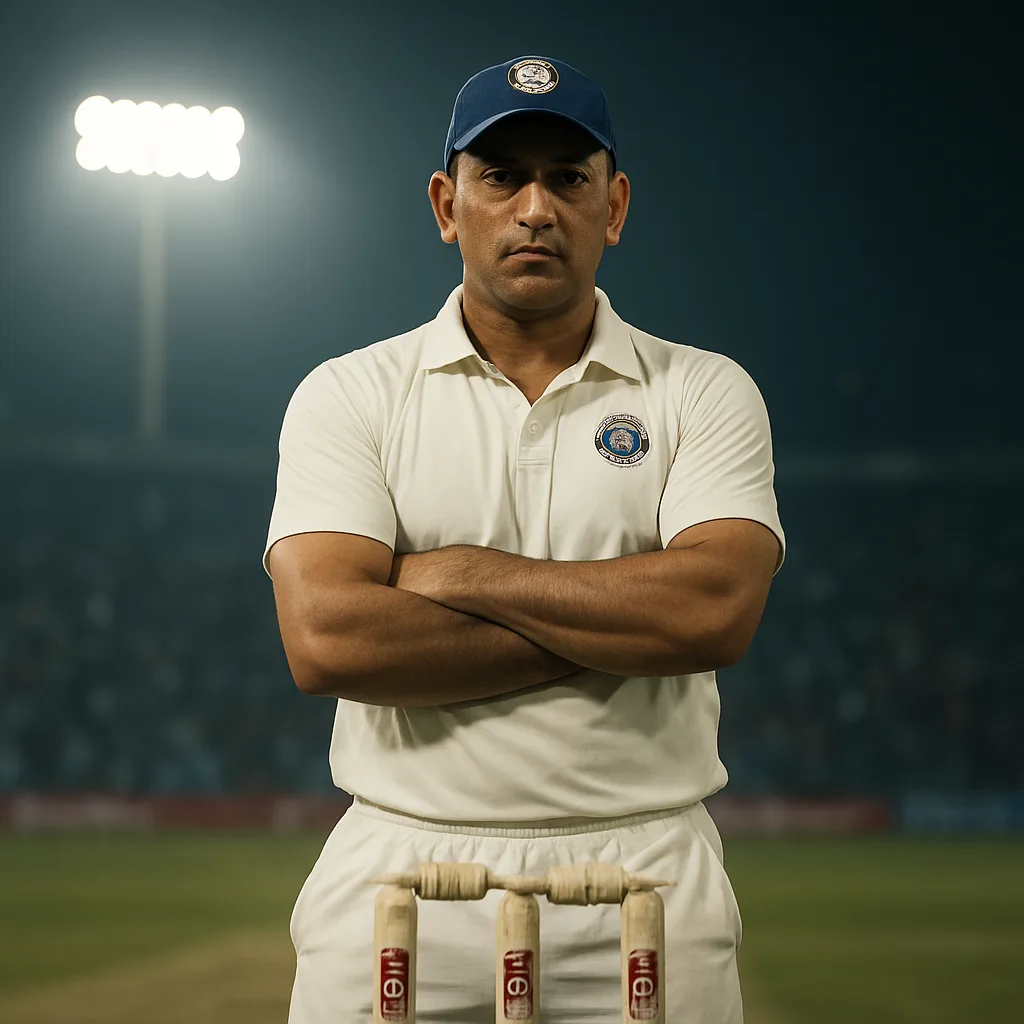
Sir Don Bradman's Legacy: The Average No One Has C
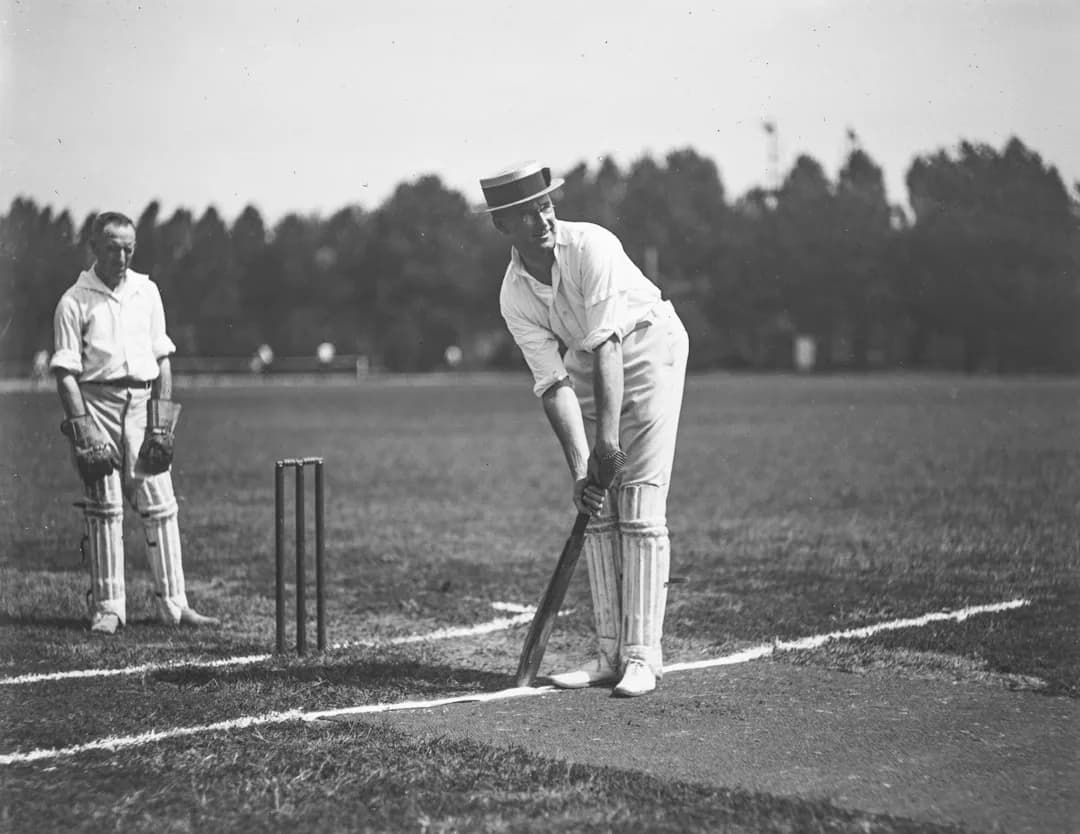
Representative image for illustration
Even now, a century later, that 99.94 haunts conversations, it reads less like a stat and more like a legend. Bottom line: Bradman changed what we expect from a batsman, and modern metrics still stumble trying to catch up.
Look, lots of records matter, but every sport has that one number that keeps dragging the conversation back to it. Honestly, 99.94 is more than just runs and dismissals, it's a cultural touchstone whenever people argue about who's the greatest. Experts say it's the most famous individual sporting average in history, and cricket authorities still reference it whenever records are discussed.
Notably, Bradman finished his Test career with an average of 99.94, a figure that has been cited in countless histories of cricket and sports encyclopedias. He played 52 Test matches and scored 6,996 Test runs, including 29 Test centuries, numbers that backstop the average and give it context. Those raw totals make the average credible as more than a quirk.
Why does it still shut down debates when today's greats average in the 50s or 60s? Because the gap is just that glaring. The gap between 99.94 and typical great averages, say, the 50s or 60s, is massive. Experts say a 40-point gap in batting average across eras is huge. Officials and cricket historians routinely point to Bradman's record as the benchmark for batting excellence, because it's both extreme and consistent across a career, not a single-season spike.
Averages can mislead, though. They don't show match situations, pitch conditions, or the quality of bowling attacks faced. Still, 99.94 is so far from the next best that people treat it less like a comparative measure and more like an icon.
One figure helps make the point: Bradman's 29 Test hundreds across 52 matches gives him a century roughly every 1.8 Tests, an incredible strike rate in any era. And the 6,996 Test runs mean the average wasn't produced in a handful of games; it was built over a catalog of high scores.
Cricket was different in the 1920s to 1940s. Pitches were often uncovered, travel was slower, and protective equipment was minimal. Those conditions cut both ways: they could make batting harder on some days, and easier on other days when bowlers tired on uncovered surfaces.
Experts who study historical sport metrics caution that raw averages need context. Era-adjusted metrics try to correct for changes in scoring rates, bowling quality, and number of matches. Those approaches still find Bradman's mark exceptional, though they reduce the numeric gap. That said, even after adjustments, the separation usually remains large enough to keep Bradman in a class by himself.
Because contemporaries played fewer Tests, aggregates like total runs are smaller for older players. So the key comparison often becomes rate measures, and Bradman's rate is extreme. The problem with rate measures is they ignore sample-size quirks unless tests and innings are large enough, and Bradman's sample is large enough to be meaningful.
Put bluntly: nobody else came close.
Comparing Across Eras to Know What Really Changed
Comparisons need more than averages. Analysts now use measures like runs per inning, strike-adjusted averages, and era-normalized scores. Sports statisticians argue that era normalization makes cross-era talk fairer. The evidence suggests Bradman's normalized scores still sit at the high end, so the claim of singular greatness survives more careful analysis.
Modern players face dense calendars, live broadcasting scrutiny, and specialized bowling attacks shaped by data science. Some say today's conditions are harder; others point out modern bats, practice techniques, and fitness make batting easier. Experts at cricket archives and analytics outlets often disagree, and that disagreement is a healthy part of interpreting Bradman's legacy.
What about match results and records, though? Tournament standings and team outcomes don't change the individual average, however match context matters. A century that saves a Test in difficult conditions arguably weighs more than a run scored in an innings where the team dominates. Still, no single player has an average that approaches Bradman's even when situational weight is applied.
One Real Example That Shows the Difference
Consider a modern great who averages in the high 50s over 150 Tests. The number is outstanding, but it's not close to 99.94. When researchers apply era adjustment, the modern player's normalized average rises a bit relative to peers, but the gap to Bradman narrows rather than vanishes. That specific comparison shows the difference between absolute and relative measures, and why Bradman's name keeps surfacing whenever cricket greatness is debated.
This matters for fans deciding who the GOAT is. Officials in cricket boards and noted historians still point to Bradman's record as a touchstone when forming halls of fame or writing official histories. That's the cultural power of one number. I think that power sometimes makes the debate lazier, people reach straight for the headline stat instead of asking harder questions.
What That Legacy Means for Today's Players and Fans
The legacy isn't a rulebook. It's a standard that forces better statistical thinking. Analysts say players should be judged on a portfolio of metrics, not a single average. Fans can get better debates if they ask about match conditions, opposition quality, and how era-adjustment changes a number.
To be fair, chasing a mythical number is silly. The truth is, modern players should aim to be the best they can in their conditions, and fans should demand more context when greatness is discussed. Look for runs in tough situations, consistency under pressure, and the ability to perform across formats. Honestly, those things tell you more about a player's value than a headline average.
That's the simple, awkward truth.
Frequently Asked Questions
Why is Bradman's 99.94 considered so special? Experts point to the size of the gap between his average and other greats, and the fact that it was compiled over 52 Tests and thousands of runs. The figure becomes more remarkable when you consider centuries per match and match-winning innings.
Can era-adjustment make a modern player 'better' than Bradman? Analysts say era-adjustment brings fairness to comparisons, but it rarely eliminates the separation created by Bradman's numbers. Adjusted metrics tend to keep Bradman at the top even while narrowing the numeric gap.
What should fans look at besides batting average? Look at runs in pressure innings, centuries per match, and performance against the strongest bowling attacks. Experts recommend combining rate measures with situational context for a fuller picture.
Final takeaway: don't obsess over one tidy number. Compare era-adjusted figures and situational performance, that's a fairer way to judge Bradman's standing and anyone else's.
Comments (0)
No comments yet. Be the first to share your thoughts!